Topic: observability
SD Times news digest: Moogsoft releases self-service observability, Anaconda Dividend Program to open-source projects, and Fuze to advance enterprise productivity
The Moogsoft Observability Cloud aims to deliver DevOps practitioners and SREs self service intelligent observability capabilities to begin surfacing actionable insights and performing advanced event management across their digital infrastructure quickly. “Old-fashioned monitoring solutions, including many that claim to be new, lead to expensive investments that take months to deliver any results,” said Moogsoft founder … continue reading

Grafana Labs updates its observability portfolio with several new products
Grafana Labs has made a number of updates to its observability portfolio this week at its virtual ObservabilityCON conference. The updates include the release of Loki 2.0, Grafana Tempo, Grafana 7.3, new plugins, and Grafana Metrics Enterprise. Loki 2.0 includes improvements to the query language, allowing users to transform logs and extract additional labels, according to … continue reading
Splunk embraces observability with new acquisitions and product release
Splunk has revealed a new observability suite at its annual .conf20 user conference this week. The suite includes monitoring, investigation, and troubleshooting capabilities designed to accelerate users’ digital transformations. “At Splunk, we believe modern application environments and open, cloud-native technologies will help our customers unlock greater business insights,” said Karthik Rau, vice president of observability … continue reading

Pixie Labs emerges from stealth with Kubernetes-native observability platform
Kubernetes-native observability platform provider Pixie Labs has emerged from stealth with $9.15 million in funding. The Series A funding round was led by Benchmark and GV also participated. According to the team, Pixie helps reduce the complexity and cost of observing and troubleshooting application performance. Developers can gain visibility into their application without needing to … continue reading
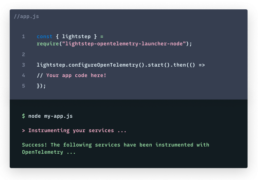
Lightstep helps developers make sense of complex apps with OpenTelemetry Launchers
Distributed tracing company Lightstep has announced the release of OpenTelemetry Launchers, a new solution for understanding complex systems. The release is based on the open-source project OpenTelemetry, which provides APIs, libraries, agents and collector services to capture distributed traces and metrics. Launcher now connects that data with Lightstep to provide observability and actionable insights, the … continue reading
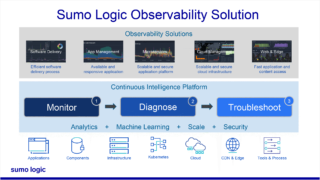
SD Times news digest: Sumo Logic announces observability solutions, Flutter 1.2 released and in-app review API for Google Play
Sumo Logic released the Sumo Logic AWS Observability Solution and the Sumo Logic Software Development Observability Solution to deepen observability across operations, security, business, and customer experiences power by continuous intelligence. “Observability is the latest evolutionary step in methodology that DevOps and DevSecOps teams employ to deliver reliable digital services that, in turn, deliver best-in-class … continue reading
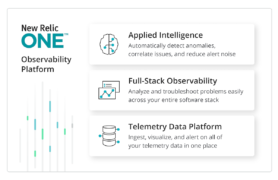
A new New Relic: Focus on full-stack observability
Longtime application performance monitoring provider New Relic is shifting gears, announcing its product focus has shifted to observability with new updates to its New Relic One platform. According to the company, New Relic One has become an expanded observability platform comprised of three products: the Telemetry Data Platform, Full-Stack Observability and Applied Intelligence. The telemetry … continue reading

An issue of ‘understandability’
This word understandability is starting to be heard, as the next evolutionary step beyond observability. And understandability is key to finding problems more quickly. Mehdi Daoudi, CEO at digital experience monitoring solution provider Catchpoint, recalled an effort when he was running monitoring at DoubleClick years ago. “I sat down with a bunch of engineers and … continue reading

The importance of tracing
Tracing, according to Lightstep CTO and co-founder Daniel ‘Spoons’ Spoonhower, provides context, which serves as the backbone for what’s happening when an application’s performance degrades. “Tracing is really just understanding causal relationships in your software,” he explained. “It sounds obvious in retrospect, but using causal relationships to form the way that data is collected, analyzed … continue reading

The modern world of application monitoring
Application performance monitoring is more important than ever, due to the rising complexity of software applications, architectures and the infrastructure that runs them. When monitoring tools first were developed, the systems they were looking at were fairly simple — it was a monolithic application, running in a corporate-owned data center, on one network. The idea … continue reading
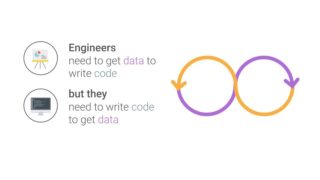
To fly slow or blind? A dilemma for developers
According to research recently published by Digital Enterprise Journal, organizations are losing $2,129,000 per month, on average, due to delays in application releases. This creates a tough choice for development teams, who are depending on fresh logs and metrics from those releases to guide their data-driven development processes forward. In other words, there’s what I like … continue reading

Three pillars of observability
Cindy Sridharan’s popular “Distributed Systems Observability” book published by O’Reilly claims that logs, metrics, and traces are the three pillars of observability. According to Sridharan, an event log is a record of events that contains both a timestamp and payload of content. Event logs come in three forms: Plaintext: A log record stored in plaintext … continue reading
