Topic: apm
Report finds chaos engineering can significantly decrease MTTR and increase availability
A new report revealed those who have successfully implemented chaos engineering have 99.9% or higher availability and greatly improved their mean time to resolution (MTTR). Gremlin’s inaugural 2021 State of Chaos Engineering report found 23% of teams who frequently run chaos engineering projects had a MTTR of under 1 hour, and 60% under 12 hours. … continue reading
Rookout shifts observability left with server performance metrics for developers
Rookout wants developers to have a bigger role when it comes to application performance monitoring (APM). The company announced server performance metrics will now be available in its debugging workflow. According to the company, while CPU spikes, memory leaks and disks filling up were previously IT operations responsibility, as DevOps shift’s left, developers need to … continue reading
IBM to acquire application performance monitoring company Instana
IBM has announced that it will be acquiring monitoring company Instana. The company explained the acquisition will help bolster its hybrid cloud and AI strategy. According to IBM, it will now be able to better help companies manage the challenges and complexities of managing application performance across teams and clouds. “With the added responsibility of … continue reading
Grafana Labs updates its observability portfolio with several new products
Grafana Labs has made a number of updates to its observability portfolio this week at its virtual ObservabilityCON conference. The updates include the release of Loki 2.0, Grafana Tempo, Grafana 7.3, new plugins, and Grafana Metrics Enterprise. Loki 2.0 includes improvements to the query language, allowing users to transform logs and extract additional labels, according to … continue reading
Splunk embraces observability with new acquisitions and product release
Splunk has revealed a new observability suite at its annual .conf20 user conference this week. The suite includes monitoring, investigation, and troubleshooting capabilities designed to accelerate users’ digital transformations. “At Splunk, we believe modern application environments and open, cloud-native technologies will help our customers unlock greater business insights,” said Karthik Rau, vice president of observability … continue reading
Lightstep helps developers make sense of complex apps with OpenTelemetry Launchers
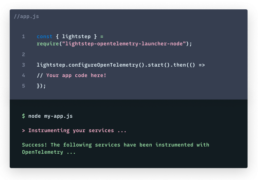
Distributed tracing company Lightstep has announced the release of OpenTelemetry Launchers, a new solution for understanding complex systems. The release is based on the open-source project OpenTelemetry, which provides APIs, libraries, agents and collector services to capture distributed traces and metrics. Launcher now connects that data with Lightstep to provide observability and actionable insights, the … continue reading
SD Times news digest: Instana to detect root cause of process crashes, AppDynamics SAP performance management solution, and Grafana raises $50 million for observability
Instana announced that its APM solution will now automatically detect the root cause of process crashes with new abnormal termination detection built with eBPF. “Instana’s new automatic crash detection and root cause analysis allows anyone involved with applications to see when and how a crash occurred so that it can be fixed, even issues that … continue reading
A new New Relic: Focus on full-stack observability
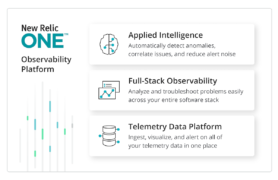
Longtime application performance monitoring provider New Relic is shifting gears, announcing its product focus has shifted to observability with new updates to its New Relic One platform. According to the company, New Relic One has become an expanded observability platform comprised of three products: the Telemetry Data Platform, Full-Stack Observability and Applied Intelligence. The telemetry … continue reading
SD Times news digest: Instana GitOps-enabled agent, .NET 5.0 Preview 7, and Linux Foundation announces the Advanced Cloud Engineer Bootcamp
Instana is adding a new GitOps enabled agent to its application performance management solution. According to the company, the Instana agent automatically supports Git-based configuration management to streamline configuration rollouts across multiple hosts. “With this latest unique capability, Instana is giving more control to users while reducing manual effort, enabling them to manage agent configuration … continue reading
premium Application stability: The missing link in next-gen app deployment
It’s a new age for software development, defined by the rise of mobile applications and iterative development releases. Today’s fast-paced development environment doesn’t slow down for anyone. If monitoring tools don’t work to promote speed and agility for the teams using them, then new solutions must be found. As a result of this mindset, mature … continue reading
Sentry helps developers find performance issues with agentless front-end monitoring
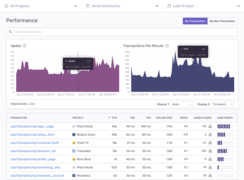
Sentry wants to give developers the ability to find and resolve performance issues with the introduction of agentless front-end performance monitoring for Python and JavaScript. According to the company, developers can trace performance issues to poor-performing APIs and other related errors in just a few lines of code. “As more organizations go digital, it is … continue reading
A guide to monitoring tools
Catchpoint offers innovative, real-time analytics across its Digital Experience Monitoring solution through the use of synthetic monitoring and user sentiment tools, which provide an outside-in view of user experiences. The tools work together to give a clear assessment of performance, as users can either contact Catchpoint directly through its portal, or Catchpoint can learn of … continue reading

